The damaged brain jumps into action within minutes of the stroke attack.
This post chronicles the brain’s recovery journey; the recovery speed varies with time. It works faster in the first three months and then slows down in the last three months.
However, it is a continuous journey. For description and management purposes, experts classify the recovery journey into five phases;
- First 24 hours (hyperacute phase)
- First 7 days (acute phase)
- First 3 months (early sub-acute phase)
- Four – six months (late sub-acute phase)
- Six months after (chronic phase)
First 24 hours
Within a few minutes of the stroke attack, either due to bleeding or a clot, the neurons living in the affected area begin to die due to lack of oxygen. This happens at a rate of 32,000 neurons per second. However, the attack alerts neighbouring cells immediately due to reduced oxygen supply. They soon begin rescue efforts. Researchers name this dynamic neighbourhood area as “penumbra”; they are a risk state. They continue to work hard to recover the jobs previously done by their already dead neighbours.
Figure 1 on Nature.com illustrates how the penumbra evolves with time.
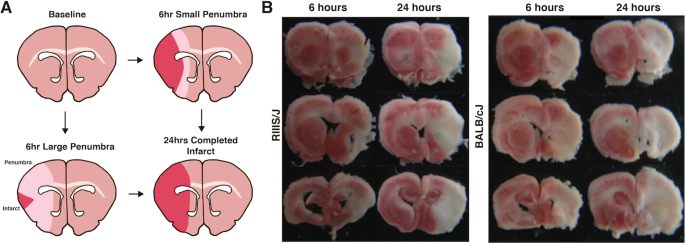
Figure 1: How a stroke and its penumbra evolves with time after a block to the middle cerebral artery in mice; source: Nature.com authored by Rudy R.F. et al. (2019) under the license of CC BY 4.0.
Figure 1
Neighbours’ rescue efforts
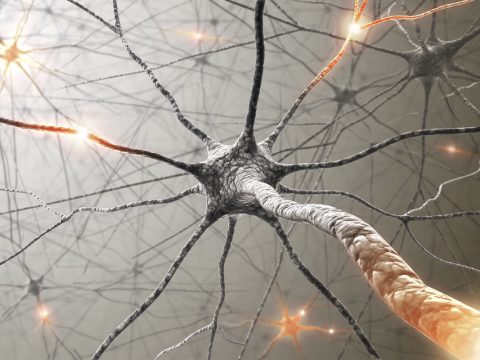
Researchers have found that the neighbours in the penumbra would start creating new dendrites, sprouting axons, and even new synapses within the first few hours of the attack. These efforts continue for three months, after which the cells slow down their recovery efforts. These new structures become essential for faster recovery. However, evidence also exists that some axon sprouting hampers the ideal recovery; it interferes with the brain’s reorganization efforts. The good news is that we can modify axonal sprouting through our coordinated stroke recovery efforts.
Read: How to regain lost movements after a stroke
strokecarer.com
Brain’s stroke recovery journey: First 7 days
On the fifth day of the attack, two-thirds of the brain’s recovery attempts seem to be over. This is because two-thirds of movements and sensations that remain six months after the attack appear as early as the fifth day.
However, it has also shown that the brain recovers another 10 per cent between the sixth and 30th day of the attack.
In other words, at the end of the first month, our beloved brain regains 86 per cent of the lost movements and sensations that remain at the end of the sixth month of the attack.
Brain’s stroke recovery journey: First 3 months
Generally, the most significant recovery occurs in the first three months.
Brain’s stroke recovery journey: First 4-6 months
After the first three months, the brain’s recovery journey slows down to a minimum speed. However, some research has found that these periods vary greatly from person to person. In other words, some may recover the lost movements much faster than others and some regain the lost abilities after one year also.
Stroke recovery is
time-dependent.
The brain’s stroke recovery journey is time-dependent. Therefore, stroke carers should assist in the brain’s hour of need.
The salvage attempts of movements and sensations fade away and become minimal after the 90th day.
These facts are not new; researchers uncovered this brain behaviour about thirty years ago.
This is how they did it.
In 1989, a team of researchers led by Pamela Duncan closely followed six months a group of 104 US individuals who experienced a stroke for the first time as a result of a block in their carotid arteries. All were in their 40s and above at the time. They grouped the study participants into four groups according to their initial severity level: mild, moderate, moderately severe, and severe. Then, they measured and compared their movements and sensation levels 5 days later, 30 days later, and, finally at the end of 6 months.
The researchers elegantly summarized their findings in the following graph.
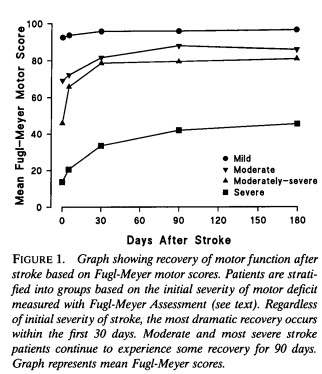
Its X-axis represents days after the stroke and the Y-axis is the score that quantifies the ability to move arms and legs.
The four horizontal lines, which run from left to right – day zero to day 180 (six months) – represent four groups of people who came to the hospital with different causality levels following the attack. The top line indicates the mild casualty group and the lines below it with worsening casualty levels – moderate, moderate-severe, and severe.
As you can see, the score – the movements – reached closest to its maximum level (86 per cent of the 6-month level) within 30 days – the first month – after the attack and then flattened out.
Remember that this was not the first and last study that reported these findings; similar findings have been reported consistently.
How do these findings become useful for stroke carers?
The most important use is that the six-month recovery after the attack can be predicted as early as its fifth day and much better after 30 days. So, you can plan what you may need to assist the affected later. Therefore, this knowledge becomes very useful for stroke carers who help to regain arm & hand movements after a stroke.
You can read Pamela Duncan et al’s full paper published in the Stroke Journal through this link: https://www.ahajournals.org/doi/pdf/10.1161/01.STR.23.8.1084
References
- Bernhardt J, Hayward KS, Kwakkel G, Ward NS, Wolf SL, Borschmann K, et al. Agreed definitions and a shared vision for new standards in stroke recovery research: The stroke recovery and rehabilitation roundtable taskforce. Int J Stroke. 2017;12(5):444–50. Accessed through this link; https://journals.sagepub.com/doi/full/10.1177/1747493017711816
- Duncan P W et al. (1992): Measurement of Motor Recovery After Stroke, Accessed through this link:https://www.ahajournals.org/doi/pdf/10.1161/01.STR.23.8.1084
